ink / performance
Less work, measured at the boundary that matters.
Published results include wins, regressions and the cost of getting started. A checked optimisation preserves meaning within its admitted domain; its speed still depends on the program, inputs and target.
Evidence is versioned per study. Each study binds its source revisions, workload and output boundary; later updates do not rerun earlier measurements.
Read the comparisons
Every result needs a baseline. Adding knowledge to a fixed compiler, improving the compiler itself and comparing with another library answer different questions. Their speedup factors should not be multiplied together.
The results below retain separate published experiments. Each report retains its acquisition date, source revisions, inputs and controls. Updating the documentation or planner does not rerun those experiments.
Direct Buffer and Map helpers
Small helpers with checked owned parameters can now expand without an already split record argument. This lets graph evaluation and adjoint updates cross more helper boundaries while retaining private buffer/map handles, source moves, readonly loans and shared caller Lists. Expansion limits and the public ABI stay the same; recursive and oversized helpers keep ordinary calls.
Two studies each use six paired fresh processes on the same 244-weight neural source, checkpoint and inputs. Ratios above one favor the new JavaScript emitter.
| Complete workload | Study 1 | Study 2 |
|---|---|---|
| Prediction, public / bound calls | 1.185× / 1.150× | 1.135× / 1.145× |
| Training, 0 / 4 / 16 predictions per observation | 1.040× / 0.949× / 1.058× | 1.022× / 1.167× / 1.161× |
Prediction improves in every pair. Training is mixed: the four-read cadence loses in study 1 and improves in study 2. All samples remain recorded, with no established cause for the variation. The module grows about 5%; import time and whole-process peak RSS remain in the raw data. These shared-host Node 22.22.1 measurements are not a universal latency guarantee, automatic planner evidence or Handwired parity. Do not multiply their ratios by the earlier improvements below.
All 62 standalone JavaScript tests pass. A required history matches 388 complete reference/Rust/JavaScript/Wasm outcomes and exact snapshots, including events, rollback and seventeen restores. The native GPU host matches its results and final checkpoint with one actual eligible word dispatch; neural training remains CPU work. A retained generic graph and complex-text source emit unchanged bytes, so this study adds no speed claim for those sources or complete Pretext fidelity. Sources, both studies, adverse cases and replay auditor.
Working records in graph and training loops
The JavaScript emitter now keeps working-record fields in local variables across bounded helpers and ordered folds, including records that own buffers or maps. Source moves, readonly loans, float rounding and logical snapshots stay checked. This removes per-step wrapper allocations without new source syntax.
Six paired fresh-process runs per study compare the same checked source before and after this change on a shared macOS arm64 host with Node 22.22.1. Ratios above one favor the new emitter. The prepared neural example has two repeated studies.
| Workload | Prepared study 1 | Prepared study 2 | Earlier defaults |
|---|---|---|---|
| Prediction, public / bound calls | 1.197× / 1.220× | 1.299× / 1.316× | 1.307× / 1.310× |
| Training, 0 / 4 / 16 predictions per observation | 1.305× / 1.289× / 1.316× | 1.294× / 1.271× / 1.345× | 1.321× / 1.297× / 1.358× |
The generic mutable-graph study also improves about 1.14× for one input and 1.08× for 64; empty work is roughly unchanged. Each graph process first checks 96 finite values and 335 complete reference outcomes. Each neural process checks 27 complete outcomes/snapshots and sixteen independent dense predictions, then compares complete training feedback, events and checkpoints.
An adverse process in prepared study 1 has training ratios around 0.58–0.63. It remains recorded; its cause is unresolved. Every pair improves in study 2. The standalone package passes all 61 tests, and a new required CPU history matches 1,251 reference/Rust/JavaScript/Wasm outcomes with exact snapshots.
These measurements start from the rounded-F32 baseline below: the speedup factors must not be multiplied. They are shared-host observations, not automatic planner evidence, a universal latency guarantee, device training or upstream parity. All sources, preliminary and adverse cohorts, exact controls and auditor.
Further storage experiments
Three subsequent private compiler experiments lose to this published baseline in six paired fresh processes each. Numeric/tagged buffers and aliased integer/float typed views have prediction ratios of about 0.49× and 0.53×; sharing scalar decodings is slightly slower, around 0.97×. Their complete training comparisons also favor the published baseline overall. Ratios below one favor that baseline; none of these designs changes the default compiler.
Complete neural feedback and checkpoints match, and additional exact-bit tests cover buffer partitions, growth, bulk copies and actual workers. These rejected experiments show why fewer conversions or a more compact layout still needs a whole-workload measurement. They establish no universal layout ranking, planner admission or GPU-training capability. Sources, all 36 processes, controls and replay auditor.
Exact float arithmetic in learning workloads
Stateful JavaScript now removes redundant conversions between F32 arithmetic operations. Every operation retains its original grouping and F32 rounding; stored values, snapshots and observable float bits keep their exact contract. The same mechanism applies to helpers, queries and actions without new syntax.
Six paired fresh-process measurements on each of two 244-weight neural examples give these median baseline/new time ratios on a shared macOS arm64 host with Node 22.22.1. A ratio above one favors the new emitter.
| Workload | Ratio |
|---|---|
| Complete neural training, 0 / 4 / 16 predictions between updates | 1.235× / 1.217× / 1.179× |
| Training with prepared defaults, same read cadences | 1.161× / 1.134× / 1.152× |
| Prediction through public / bound calls | 1.000× / 1.001× |
| Prepared-default prediction, public / bound calls | 1.026× / 1.009× |
Each process first validates complete reference outcomes and checkpoints, plus independent dense predictions. The complete JavaScript suite passes 60 tests; the added cross-target history matches 772 outcomes across reference, Rust, JavaScript and Wasm, including events, rollback and exact snapshots.
Prediction is mostly unchanged. Tiny workloads sometimes regress, and earlier slower prototypes remain recorded. This is a local CPU training improvement, not a GPU training or upstream performance parity claim. The measurements are not admitted planner evidence and should not be multiplied by other speedups. Retained sources, all cohorts, exact controls and auditor.
Learned structure specialization
An explicit frozen learned choice can now specialize its serving computation. In the measured example, a choice lookup, representation dispatch and helper call collapse to a packed word operation plus a live-row offset. The baseline already runs the packed branch; this does not compare eight executed branches with one.
Complete warm JavaScript state.invoke calls on one macOS arm64 host with Node
25.3.0 use five fresh processes and seven paired samples per process. Every reply
is consumed; reply/checkpoint controls and preparation are outside serving timing.
| Live rows | Frozen baseline (µs) | Checked specialization (µs) | Ratio |
|---|---|---|---|
| 0 | 0.0944 | 0.0897 | 1.053× |
| 32 | 0.1192 | 0.1090 | 1.094× |
| 1024 | 0.1120 | 0.1051 | 1.066× |
The generated source shrinks by 136 bytes, while the inventoried package grows from 342,529 to 2,705,662 bytes because it retains portable proofs, selected source and compilation metadata. Single build-stage observations were 1.59 and 2.60 seconds; they are not a repeated lifecycle or amortization model. These modest serving gains do not establish a profitable automatic choice, a memory improvement or a broad neural-network speedup.
Independent conformance includes 439 private core tests, selected native/JS/Wasm histories and 93 browser observations with an actual eligible WebGPU call. Stateful work remains on the host. Learned choices and objectives · Exact artifacts, raw samples, setup costs and limits.
Owned graph state projection
A new knowledge recipe proves that a fold can use smaller working state. In one 32-instruction F32 graph, it removes an unused total and carries the node-value buffer directly. Numeric weights remain live; the checked plan retains the original program's checkpoint namespace.
Six alternating fresh Node 22.22.1 process pairs measure 250,000 requests after 10,000 warmup requests per workload. Every returned value contributes to the checksum, and final exact snapshots match. Median paired speedups are:
| Workload | Baseline / projected time |
|---|---|
| Read only | 1.14× |
| Weight update every eight reads | 1.15× |
| Weight update every read | 1.20× |
One pair has substantial timing noise, including a 0.37× loss. Every raw sample is retained. The earlier unrolled record layout was slower in its two-process pilot; its initial combined projection/unrolling proposals exhausted proof resources. The follow-up below now checks that composition. These are workload-specific observations, with no Handwired parity claim or automatically enabled selection.
The U32 source example passes 111 reference/native Rust/JavaScript/Wasm action comparisons, including events, rollback and exact checkpoints. The F32 projection matches 175 independent reference histories. That report records 486 passing standalone core tests; implementations and the toolchain remain trusted. This is not device-training or general neural-graph coverage.
All samples, slower pilot, source/proof artifacts and limits.
Composed graph variants across backends
The current CLI can compose smaller owned working state with frozen graph specialization while numeric weights remain live. Ordinary source-wrapper and forwarding-helper equations make the complete four-step plan check with the same core and resource limits. The new test matches 88 reference/native Rust/JavaScript/Wasm outcomes, including five restores, exceptional float bits, events and rollback. All 175 separate JavaScript history steps also match.
Six rotated fresh-process triples per backend measure the same 32-node graph, 250,000 requests after 10,000 warmups and three weight-update schedules. On the Apple M4 Pro host, the preferred implementation differs by backend:
| Backend | Projected fold throughput / baseline | Projection + unrolling throughput / baseline |
|---|---|---|
| Node 22.22.1 | 1.144–1.159× | 0.876–0.907× |
| Native Rust, release | 0.991–1.004× | 1.744–1.811× |
Every native checksum and complete checkpoint matches its JavaScript counterpart. The Rust comparison uses typed state calls and one benchmark image containing all three implementations. These are comparisons within each backend, with no Rust-versus-Node or Handwired parity claim. Every sample, including JavaScript timing noise, is retained. Cold startup, peak memory and general lifecycle profitability remain unmeasured; no automatic selection is enabled.
The bounded frozen corpus completes all ten unchanged programs and admits alternatives, but all retain baseline at the measurement-evidence gate. The graph remains a development example, without demonstrated held-out benefit for this combination. A source-checked Cargo rebuild reproduces every measured JavaScript/Rust image byte for byte. General mutable-graph staging and device training remain open.
Complete plan, all samples, corpus receipts, source reproduction and limits.
Mutable graph specialization validation
A generated exact guard now selects a specialized branch while its graph and weights remain trainable, retaining the generic evaluator for other graph shapes. The 32-node owned F32 case passes 335 reference/Rust/JavaScript/Wasm observations, including events, rollback, exact snapshots and six restores. Seeded JavaScript startup also matches. Learning updates change both structure and weights. The hand-written guard control passes its separate 335-outcome history. The aligned standalone core passes 503 tests across 83 integration targets; the complete JavaScript package passes 59 tests and 24 knowledge regressions pass. Factored database proofs run on the ordinary test stack without raising checker limits.
The first JavaScript lifecycle comparison now finds that the generated guard loses on this workload. Removing an unobserved accumulator field through an ordinary checked projection works better. Eight groups of four fresh processes compare the same source under generic, guarded, projected and composed plans. Ratios below are baseline time / variant time; above one favors the variant.
| Bound state workload | Guard | Projection | Projection + guard |
|---|---|---|---|
| Matching graph, 1 input | 0.657 | 1.106 | 0.745 |
| Matching graph, 64 inputs | 0.858 | 1.064 | 0.938 |
| Graph/weight learning, 8 matching reads | 0.872 | 1.072 | 0.941 |
The Apple M4 Pro / Node 22.22.1 comparison also covers early and late mismatches, empty graphs, 1024 inputs, short lifetimes and frequent learning writes. Every process checks 96 finite reference values and the 335-outcome exact-snapshot history. Setup, import, recovery, complete output consumption and whole-process peak RSS are retained separately. The shared host was not CPU-isolated; these are diagnostics rather than admitted planner evidence or native/GPU speed claims. Moving guard preparation to configuration changes and profitable learned representation selection remain open. The earlier frozen-graph ratios above do not establish this path's performance.
Complete replayable evidence and limits.
Lifecycle measurements, all variants and auditor. The external prefix producer now composes the measured six-step plan and passes 26 related knowledge regressions, including legacy feature versions and rejected prefix proofs. This changes the CLI tooling; the browser editor retains its separate pin.
Exact JavaScript constants and checker follow-up
Pure JavaScript modules now emit finite F32 constants directly as their exact binary64 values. Nonfinite values retain bit constructors; arithmetic rounding and stateful bit carriers are unchanged. Six alternating Node process pairs measure 1.068× median throughput for a 244-parameter Adam update kernel. Small affine-map differences are within the scale of control variation. The measured module shrinks from 217,765 to 216,838 bytes. This is update-kernel evidence, with no end-to-end training or Handwired parity claim.
All 44 JavaScript integration targets pass, including 4,265 constant bit patterns. A fresh build from published packages reproduces the measured module exactly. The checker follow-up also repairs a CI proof-budget regression without raising limits: all 488 standalone core tests and the existing 144-outcome reference/Rust/JavaScript/Wasm history pass locally. The composition follow-up above closes that bounded graph proof; general graph compilation remains open. Local checks do not establish a green distribution CI run.
Complete results, retained failures, exact pins and reproduction.
Whole neural computation proof capacity
The staged 244-parameter neural application now exports all six actions, including mutable optimizer/control state, as 316 ordinary checked mathematical definitions. The complete canonical model is 5,073,076 bytes. These are proof-data counts and sizes, with no new runtime speed measurement. The source-to-proof implementation remains trusted.
The identical standalone core source passed 480 tests across all 80 integration targets, library checks, example builds and doctests. Three earlier compiled artifacts replay their source-bound selections with the new core. This expands the optimization proof domain; graph specialization and profitable selection remain further work. Retained complete model, source identities and test logs.
Frozen program with live weights
An eight-operation F32 program can now compile its frozen operation sequence into straight-line serving code while its numeric weights remain trainable. Complete typed, in-memory JavaScript bound state calls use changing inputs; update phases include learning-action execution and event acknowledgement. Every variant must match complete result checksums and portable checkpoints.
Six fresh processes on one macOS arm64 host with Node 25.3.0 alternate variant order. Each process records five warm samples of 25,000 requests per phase. Values below are geometric means of process medians; setup and checking are outside these warm serving measurements.
| Weight updates | Baseline ns/request | Selected ns/request | Speedup | Paired range |
|---|---|---|---|---|
| None | 162.86 | 103.58 | 1.572× | 1.364–1.711× |
| Every request | 482.11 | 426.86 | 1.129× | 1.061–1.228× |
| Every 16 requests | 165.86 | 116.87 | 1.419× | 1.380–1.508× |
| Every 256 requests | 142.03 | 95.96 | 1.480× | 1.415–1.604× |
Unrolling initially made the same serving workload slower: 136.83 versus 155.80 ns/request, or 0.878×. General JavaScript binding placement removed nested function wrappers and produced the final gain. The report retains both acquisitions, all processes and the unchanged selected core. Simpler source alone does not prove profitable execution.
The complete package grows from 295,553 baseline bytes to 1,330,441 selected bytes because it retains portable proofs and source metadata. Compact checked proofs reduced the earlier selected package from 2,102,244 bytes. Generated JavaScript source remains similar in size. Startup and separate heap/RSS diagnostics do not establish a cold-start or memory improvement; single build observations do not establish a compilation-cost advantage.
Independent validation includes 446 private core tests, 57 JavaScript tests and 144 cross-target observations with exact checkpoints. One eligible pure control runs on GPU; stateful serving and training remain on the host. A fresh committed compiler/package checkout reproduces executable images and startup state byte for byte. This is finite implementation evidence, not whole-compiler correctness.
This configured sequence does not demonstrate learned opcode selection, large neural graph compilation or upstream neural/GPU performance parity. Automatic selection still needs comparable lifecycle evidence.
Compile structure while weights stay live · Exact artifacts, raw samples, regression and costs.
A later correctness acquisition adds 450 isolated core tests and explicit browser replays: 432 comparisons for the operation sequence and 99 for a separate 244-value model with live learning state. Both include an actual WebGPU control; stateful work remains on the CPU host. This corrects the earlier report's browser coverage wording, whose retained receipts established native wgpu execution. Fresh committed sources reproduce the measured eight-op executable images byte for byte, but these additional checks do not rerun the timings or establish a speedup for the larger model. Bound browser images, proof replay and correction.
Factored closed-data proofs subsequently extend complete exceptional F32 lists through 512 values. The runnable 244-value package preserves live training and passes 99 browser comparisons, including three atomic rejections of an altered frozen checkpoint. Compacting its complete proof-bearing plan reduces selected inventoried bytes from 4,131,526 to 1,704,472; the compact baseline is 296,952 bytes. Every JSON field remains, and executable images and proof bytes are unchanged by serialization. Fresh committed sources reproduce the executable images. This acquisition measures package size and correctness, with no new runtime speedup claim. Exact artifacts, checks and remaining limits.
Longer frozen programs
Shared typed helpers extend explicit CLI specialization to 32 and 128 ordered operations with live weights. Six fresh Node 25.3 processes per size and comparison on an Apple M4 Pro alternate variant order. Each process records five samples of 25,000 complete bound requests after 2,500 warmup reads; update rows include weight changes and event acknowledgement. Values are geometric means of paired process medians. Every output is consumed and ending checkpoints agree.
| Operations | Weight updates | Baseline ns/request | Shared ns/request | Speedup |
|---|---|---|---|---|
| 32 | None | 325.94 | 222.50 | 1.465× |
| 32 | Every request | 545.44 | 460.04 | 1.186× |
| 128 | None | 1113.37 | 734.25 | 1.516× |
| 128 | Every request | 1067.35 | 798.47 | 1.337× |
A separate six-pair comparison against the earlier expanded selected layout measures 1.06×/1.17× for reads and 1.03×/1.09× with every-request weight updates. Sharing retains every call and operation; repeated code needs 3/5 definitions instead of 7/31. Both layouts require complete proofs; expanded code remains an explicit proposal option for other target/objective tradeoffs.
At 128 operations, JavaScript falls from 313.0 to 241.8 KB. The initialized WebGPU-host inventory falls from 86.6 to 22.1 MB, including generated sources and compiled CPU fallbacks. These are file bytes, not compressed downloads or heap measurements. Import and first-binding diagnostics improve over expanded code, but still favor the unspecialized baseline. Source/proof construction, compilation and startup are outside warm samples; this does not establish a cold-start or short-session advantage. Every raw sample is retained, without exclusions.
Both sizes pass full CPU-target histories with exact checkpoints. A browser history adds 465 comparisons and twelve actual GPU calls, eleven of them for a 64-operation model prefix with raw F32 inputs/weights. Complete 128-operation stateful serving and training execute on the CPU. At that milestone its pure root exceeded the graph-stage budget; scalar grouping below removes that limit. A fresh committed compiler recreates the initialized 128-op JavaScript images. These are internal operation-sequence results, with no claim of neural convergence, GPU training or matched upstream-library parity.
The earlier expanded-layout acquisition retains its original results. The new acquisition includes all 24 paired processes, complete plans, initialized artifacts, source reproduction, GPU prefix history, planning-corpus funnels and the failed 512-operation proof-budget probe.
Proof construction scales to 512 operations
Suffix-parametric prefix proofs reduce the 128-operation plan from 3,292,182 to 836,086 bytes with byte-identical selected core and JavaScript. Six alternating pairs measure about 2.6/1.1 seconds for complete previous/new proof construction and normal checks (2.41× paired geometric improvement). Corpus evaluation ran concurrently; this is a workstation build diagnostic, not a serving speedup.
The formerly rejected 512-operation case now produces a 1.92 MB plan under unchanged budgets. It passes full CPU-target/GPU-host histories and 432 initialized browser comparisons at that milestone. The later scalar grouping below executes complete pure model roots on the GPU; serving actions and training still execute on the CPU. A fresh committed-source rebuild recreates its JavaScript baseline and selected artifact images byte for byte. No new warm serving, whole-model GPU or convergence claim follows.
Complete plans, all authoring samples, negative controls and reproducibility.
Scalar GPU stages
Pure scalar statements and helper calls can now share one literal ordered shader stage. The 64-operation model helper falls from 64 stages to one, while the previously unsupported 128/256/512-operation helpers each become one stage. Collection stages and arithmetic meanings stay unchanged; no budget was raised.
Six fresh Chrome processes, alternating case order, measure complete warm async calls including input capture, upload, dispatch, readback, decoding and full reference-value checking. Medians of process medians on Apple M4 Pro:
| Explicit backend / operations | Microseconds |
|---|---|
| Previous GPU / 64 | 975.94 |
| Grouped GPU / 64 | 508.54 |
| Grouped GPU / 512 | 498.96 |
| Wasm CPU / 512 | 7.60 |
| JavaScript / 512 | 6.46 |
The paired geometric GPU64 improvement is 1.84×. Single scalar calls still strongly favor CPU/JavaScript. Imports and initial shader setup are outside these samples and retained separately. This async boundary differs from the earlier bound-state serving measurements. The first six pairs overlapped GPU conformance; both that set and the second six-pair acquisition are retained, with every raw sample. No exclusive-machine, cold-start or automatic-profitability claim follows.
Full 32/128/512-operation pure roots pass eleven raw F32 input/weight classes on actual GPU execution. The initialized 512-operation package passes 465 browser comparisons, including twelve device calls. Wide words, signed wrapping, records and lazy-default cases add 38 device calls. A private pinned-source rebuild reproduces all 30 WGSL shaders and 140 host/descriptor images byte for byte. Serving actions and learning remain CPU work; device training and broader batched/resident/upstream workloads remain open.
Full stage graphs, timings, artifacts and implementation assurance.
Learning a program, then compiling it
The current CLI example learns a 32-operation program from a complete-output objective over an authored finite instruction grammar. On one seed and seven training pairs, the probability mass on matching programs rises from 4.30% to 85.16%. This measures fitting on those samples, with no held-out accuracy or convergence claim.
The follow-up compiles closed calculations, including the instruction counter, into exact constants while keeping weights and goals editable. Ordinary proofs still check the complete actions. On Apple M4 Pro with Node 25.3.0, six alternating-order pairs use one artifact and one workload per fresh VM, with a full warmup block before five measured blocks. The complete request histories have equal checksum vectors and final checkpoint digests; separate conformance checks compare individual replies and snapshot bytes.
| Request | Baseline ns | Selected ns | Geometric paired speedup |
|---|---|---|---|
| Serve | 237.91 | 172.57 | 1.372× |
| Serve, weight update every 16 requests | 264.46 | 195.52 | 1.047× |
| Loss over seven rows | 1,324.28 | 812.22 | 1.630× |
| Loss, goal reset every 64 requests | 680.07 | 341.56 | 1.986× |
Latency columns are medians of process medians; the paired column includes every pair. One weight-update pair loses substantially (0.292×), reducing its geometric gain despite the displayed medians. The report retains this outlier and earlier noisy runs. Isolated Node 22 runs also vary significantly; these results do not establish a universal engine win.
Against the previous specialized layout under the same isolated Node 25 protocol, loss evaluation improves by 1.55× and goal-reset requests by 2.21×. Serving remains approximately unchanged. The earlier shared-VM study's 17% goal-reset regression uses a different protocol and is retained as historical evidence.
The complete artifact inventory falls from 9.16 MB for the previous specialization to 2.96 MB, including proofs; the unspecialized baseline is 1.30 MB. The generated descriptor now references one checked package instead of embedding another copy. These inventories are separate from runtime heap, downloads and setup costs. Automatic planner selection still requires comparable profitability evidence.
The retained checks include complete training replay, 7,707 closed scalar calculations checked by the kernel, 99 browser comparisons with 12 actual GPU calls, 43 hardening tests and 22 reproduced images from a clean committed-source compiler build. Training runs on CPU hosts. General learned representations, device training and the upstream performance targets remain open.
Raw samples, controls, proofs and scope · Earlier measurements · Learn instruction sequences.
Ordered query expressions
The first ordered-query milestone compares query syntax, ordinary Ink pipelines/loops and handwritten Rust/JavaScript controls. The following held-out times are microseconds per complete warm call including output consumption, using three fresh processes and eleven samples per process on one macOS arm64 host.
| Workload | Query | Ordinary Ink pipeline/loop | Handwritten target control |
|---|---|---|---|
| Rust filter, 4096 rows / broad result | 5.526 | 5.757 | 5.454 |
| Rust filter, 4096 rows / selective | 3.114 | 3.435 | 2.201 |
| Rust existence, first of 4096 | 0.198 | 0.197 | 0.004 |
| Rust join, 256 × 256 | 24.760 | 36.946 | 21.414 |
| JS filter, 4096 rows / broad result | 25.988 | 26.061 | 23.789 |
| JS join, 256 × 256 | 91.369 | 131.806 | 54.413 |
The broad filter is close to the ordinary pipeline and handwritten Rust. Selective filters, joins and native early-exit calls retain material gaps. Native Ink typed calls own their input vectors and include cloning reusable caller data; handwritten Rust borrows slices. The existence comparison therefore exposes a storage/call-boundary cost as well as traversal. JavaScript compares exported trusted calls with direct handwritten functions. The report retains empty/small cases and all raw samples; these timings are not a universal speed claim or an automatic selection decision.
Cross-target conformance separately checks 113 values, outcomes and exact snapshots, including 19 actual eligible wgpu calls. It does not establish a GPU speedup. The milestone adds no database pushdown or index/hash-join selection.
Matched Handwired searches
On an Apple M4 Pro with Chrome 155, an explicitly authored packed Ink literal matcher returns complete counts for 100,000 documents in 3.6–3.8 ms in warm resident-GPU calls. Handwired's public search API takes 12.4–13.5 ms for the same three literals across development and held-out corpora: a 3.3–3.6× difference. The earlier Ink DFA takes 4.5–5.1 ms under the same protocol, so packing itself accounts for a smaller 1.2–1.3× improvement. Parameters, dispatch, readback and complete output consumption are timed; initial encoding and setup are separate.
This is a specialized literal algorithm compared with a richer regex engine, not a general regex or neural-execution win. Three page loads per large corpus share one browser process. Paused GPU requests are slower, small inputs favor CPU execution, and a comparable end-to-end first-call result remains open. Allocation-free UTF-8 reads improve this Ink JavaScript pipeline by 5.9–8.7×, while it still loses to native JavaScript search. The owning native Rust API also remains slower than the handwritten borrowed control.
Independent complete-output checks cover both large corpora and size controls. Separate conformance checks cover 128 library cases across reference, Rust, JavaScript and Rust-Wasm, including 48 actual eligible wgpu calls. Eight scalar proofs establish components, rather than correctness of the entire matcher or compiler. The separate conditional-fact experiment below measures initial Freerange-inspired inference; Pretext-inspired gains remain open.
Raw samples, reproducer, controls and limits · Broader contracts and preparation work
Automatic derivatives and prepared context
Whole-objective gradients execute through pure helper functions, structured numeric state and bounded rollouts. Full gradients now carry all basis directions through one primal pass. Tangent work still scales with parameter count. Generic JavaScript local scalar-record storage and F32 carrier bookkeeping reduce overhead without reassociation, discarded zero-times-infinity arithmetic or approximation.
| Warm complete JavaScript call | Previous full gradient | Batched gradient | Repeated JVPs | Handwritten |
|---|---|---|---|---|
| 0 context values | 5.218 µs | 2.784 µs | 1.815 µs | 0.579 µs |
| 16 context values | 7.246 µs | 4.542 µs | 8.330 µs | 0.663 µs |
| 4096 context values | 1.356 ms | 0.780 ms | 1.556 ms | 0.109 ms |
| 32768 context values | 18.779 ms | 8.985 ms | 22.297 ms | 1.000 ms |
These held-out medians use three fresh processes, eleven randomly interleaved samples per process, an independent polynomial derivative oracle and complete output consumption. Both compiler versions run on identical inputs in each process on an Apple M4 Pro with Node 22.22.1. Preparation is included; no context survives across calls. The previous emitted module is frozen from the earlier delivery. Raw samples, modules, source and reproduction.
This improves the large gradient 2.09×. Separate JVPs remain cheaper for empty input, and the authored derivative remains about 9× faster at the largest size. It is one designed workload, not broad neural-training performance, Handwired parity, first-call latency, peak-memory evidence or GPU-training speed. The initial preparation comparison retains the earlier small-input regressions.
Two ordinary database equations universally compare batched and separate-direction results for specific polynomial/nonlinear kernels in their exact definition contexts. Source application rejects stale contexts even after a source-hash refresh. These compare generated implementations; they do not prove the general AD formulas, checker or backends correct.
Local acceptance covers 105 cross-target values/outcomes and exact snapshots, including five actual GPU calls across four scenarios. Those include a twelve-step trajectory gradient and an implementation selected using the new proof. Stateful learning remains on the host. Acceptance receipts and scope.
Prepared numeric tables
A Pretext-inspired proposal prepares a numeric table once outside a map when it does not depend on the current item. Whole-function equality proofs, including an empty-input guard, are checked before selection. This is a preparation mechanism; full Unicode/browser text-layout parity remains open.
| Complete JavaScript call | Before | Selected |
|---|---|---|
| 512 indices, 256 table values | 147.208 µs | 1.291 µs |
| 32 indices, 16 table values | 1.383 µs | 2.143 µs |
These held-out results are medians of three fresh Node processes, each with eleven paired samples, including preparation and full output consumption. They use designed workloads, no retained cache across calls, and an independent direct lookup oracle. The small-case regression is a reason to retain profitability gates. They do not measure browser layout or cold first-call latency. Raw receipts and procedure.
Required-target checks compare 94 cases across Rust, JavaScript and Wasm, including exceptional F32 values. GPU-host comparison uses CPU fallback for these cases; it does not establish device preparation support. Full verification logs.
Conditional unsigned facts
The first Freerange-inspired addition extends Ink's existing unsigned analyser with excluded values and relational range refinement. Offline acquisition proves four complete source equalities before publishing them into the normal database catalogue. Independent value tests and 88 compiled conformance cases include one actual eligible GPU call.
On an Apple M4 Pro with Node 22.22.1, the held-out boundary-distribution batch of 65,536 relational-mask calls takes 0.788 ms before and 0.459 ms after the proved replacement. Two U64 guard batches take about 1.11 ms before and 0.40 ms after. The mapped-list case changes from 0.165 to 0.155 ms. Three fresh processes per cohort retain eleven paired samples each, full output checks and every consumed result. Other distributions show smaller changes, and unchanged controls include small regressions. These are designed mechanism workloads; proof acquisition and compilation are excluded, and broad application gains remain unestablished.
Compiler and planner
The frozen planning corpus contains ten programs. Selection uses development inputs; evaluation uses 24 separate inputs per program spanning sizes and distributions. The JavaScript harness uses paired, interleaved timing and checks the outputs.
| Comparison | Published result | What changed |
|---|---|---|
| Updated compiler and selected plan versus previous default | 1.73× geometric-mean speedup across ten programs | Compiler improvements and planning together |
| Selected plan versus the same compiler's baseline | 1.29× geometric-mean speedup | Five of ten programs select alternatives |
| Incremental-distinct versus previous default | 10.02× geometric-mean speedup | Ownership-based in-place appends, with the baseline still selected |
These averages include regressions. The same-compiler comparison reports 39 robust gains and eight robust losses across its evaluation cells. Small compact-set inputs lose despite gains at larger sizes, and sequence-every shows a small overall regression. The corpus is ten small programs on one JavaScript host, not a forecast for arbitrary applications.
Corpus protocol, per-program results and regressions · Ownership analysis and in-place appends
Knowledge with the compiler fixed
The separate proof-growth experiment adds reusable law families without changing the compiler during the study. At 16 families it reports 2.17× geometric-mean speedup on designed JavaScript inputs and 2.39× on its actual AST/mesh cohorts, relative to zero families.
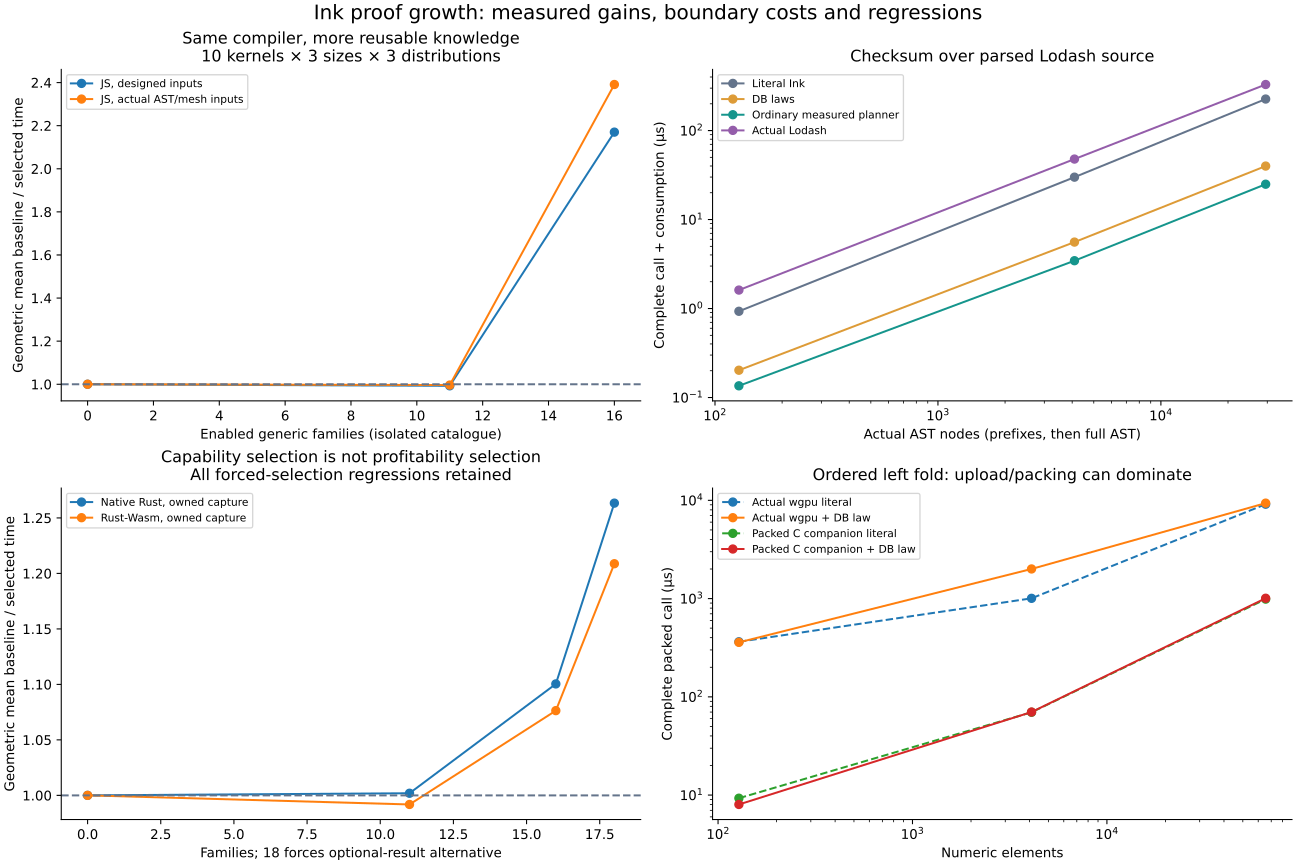
Native Rust and Rust-Wasm ratios are 1.10× and 1.08× at that checkpoint. The fused GPU cohort is 0.79× and therefore slower on average. These are selected kernels with their stated boundaries; entry count alone does not predict useful optimisation coverage.
JSON and state
An earlier compact-construction release compares separate boundaries against Frontier. Results are medians of three fresh-process medians on a shared Node 26.1 / Apple M2 host, with complete-output preflight and rotated timing rounds. Time is in microseconds per call; lower is better.
| Boundary | Ink | Frontier | Comparison |
|---|---|---|---|
| Detached result from stable prepared logical inputs | 53.030 | 97.791 | Ink 1.84× faster |
| Compact message encode | 0.464 | 0.654 | Ink 1.41× faster |
| Portable message encode | 0.645 | 0.654 | Approximately tied |
| Compact message decode | 0.783 | 0.605 | Ink takes 1.29× longer |
| Portable message decode | 1.318 | 0.605 | Ink takes 2.18× longer |
| 4096-row replacement | 2.559 | 0.718 | Ink takes 3.56× longer |
| Prepared replacement, preparation excluded for both | 0.771 | 0.446 | Ink takes 1.73× longer |
| Text to known edit to text | 360.424 | 80.016 | Ink takes 4.50× longer |
Compact messages require prior agreement on the exact schema and format; portable messages identify their schema. The detached-result lane uses stable, well-typed inputs. Ink's checked external-input path includes additional validation and is measured separately. Exact numeric tokens, member order, ownership and protocol differences remain part of the comparison.
Direct compact construction improves Ink's complete 32-document initialization phase by 1.51× against logical parse/encode, but still takes 1.81× longer than its corresponding Frontier control. Earlier retained-edit and indexed-query wins are different boundaries; the indexed implementation is explicitly supplied rather than automatically selected. Ink has not achieved an all-metrics win.
Startup and memory
Retaining 32 owned 512-field JSON trees measured about 3.82 MB of GC heap in Ink versus 0.79 MB in Frontier. A 4096-row live-state fixture with acknowledged events measured about 3.24 MB versus 0.84 MB. These show remaining storage costs even where individual operations are faster.
Imports, construction, first use, retained buffers and process peak memory are recorded separately. Forced-GC heap deltas on a shared host are diagnostic observations, not exact allocation counts or universal memory bounds. Compare complete lifecycles before choosing a representation.
Selection policy
Proof admission, target eligibility and profitability are separate gates. An implementation must preserve the required meaning and be executable on the target before cost evidence can select it. Missing comparable lifecycle evidence keeps selection on the baseline, including plans made only of checked maintained folds. The former asymptotic-only exception is removed: equal asymptotic write cost does not establish better setup costs, latency, memory or migration. Automatic selection needs comparable lifecycle evidence or an admitted validated work model.
The work-model path is an explicit experimental option in the Python compiled planner. Supply both --work-model and --work-workload to enable it. It can predict gains when ordinary selection lacks comparable evidence; it does not override a timing-based decision. Its current held-out study selected one of ten programs, with a 1.53× gain for that program. The reference-fuel model was rejected. This is narrow evidence, not established general prediction.
Current planner safeguards include:
- Average work per phase before applying lifecycle frequencies, so extra sample inputs do not silently alter the workload mix.
- Bind both model and workload contents into the compiled-plan cache key; replay the selected proof chain on a cache hit.
- Retain the baseline when a memory limit or nonzero migration count needs evidence the work model does not provide.
- Keep model selection opt-in and report the decision separately from measured speedups.
Work-model protocol and held-out results · Selection reference
Research under evaluation
A checked physical plan can now remove single-field record wrappers in compiled JavaScript. In three fresh-process cohorts, the selected 4,096-row state retains 2.33 MB versus ordinary Ink’s 3.24 MB: 28.3% less heap. Replacement takes 2.32 µs versus 2.85 µs, an 18.4% reduction. Frontier still wins at approximately 0.7 µs and 0.84 MB. Public JSON trees keep their logical format and do not gain this memory reduction.
Selecting the layout across the whole module makes logical JSON calls slower because they convert inputs and reconstruct outputs. Detached edits take 328 µs with elision versus 37 µs with ordinary Ink and 101 µs with Frontier. The previous Ink release rerun also takes about 36 µs, so the older 53-to-37 µs comparison does not establish a new compiler speedup. These are explicit alternatives, not an unconditional default. Private captured-value and wire boundaries are now supported; their separate measurements appear below.
Earlier flattened-sum, tagged-word and dictionary probes remain isolated carrier experiments. They do not establish compiled action or transaction performance. The measured modules precede the concurrent JavaScript object-adapter addition; reports retain their exact bytes and scope.
The native proof-authoring path now offers an explicit shared-v2 Boolean circuit encoding alongside the unchanged default literal-v1. A representative obligation shrinks from 78,828 clauses to 1,763. This reduces proof construction costs; it does not establish a compiled-program speedup or authorise a new datatype layout. The report also records two baseline hardening-test failures that remain open.
Compiled layouts, experiments and limits · Shared circuits, trust scope and open tests
Captured private values
The compiled JavaScript module now offers typed opaque handles through compiledValues and callCompiled. Capture validates and owns the input once; subsequent calls retain the private representation. Materialize an owned public value only when needed, or encode the handle directly for transport. Binary calls also use literal private readers and writers. These boundaries apply to general first-order Ink values.
The archived fused-capture cohort compares exact previous and fused-capture modules with the same source, physical plan, ABI and benchmark. Three fresh processes per implementation alternate on the shared Node 26.1 / Apple M2 host. These figures do not represent a fresh run of every later compiler revision.
| Boundary | Previous Ink µs | Fused-capture Ink µs | Paired Frontier µs |
|---|---|---|---|
| Warm capture of three typed arguments | 580.693 | 89.770 | 23.159 (document clone only) |
| Capture, edit and detached owned output | 616.112 | 124.542 | 126.854 |
| Prepared edit and detached owned output | 36.139 | 36.482 | 103.290 |
Literal validation, ownership and private conversion now run in one traversal, making warm capture 6.47× faster and the capture/edit/output lifecycle 4.95× faster than the paired previous module. Prepared owned execution is 2.83× faster than Frontier. The fresh-input lifecycle is close to Frontier on this fixture; its small difference is not a robust win. Ink validates its typed logical input while Frontier clones a native document without matching validation, and neither ingress lane includes JSON parsing.
Cold codec construction takes 571 → 418 µs; first capture after construction takes 2,660 → 1,619 µs. Cold import takes 11.1 → 11.9 ms with additional literal helper code. These are separate single observations per process, aggregated across three processes. Earlier initial-capture figures included lazy codec construction and should not be pooled with this split. Private-only or encoded outputs remain different boundaries, with no matched Frontier win claimed.
That archived layout measured a full binary text pipeline of 797.950 µs and a logical text pipeline of 830.311 µs. Later cohorts below use different output paths and controls; absolute timings across epochs do not establish causal speedups. The end-to-end Frontier goal remains open. Workload profiles must account for setup, reuse, retained memory and the chosen output boundary.
The frozen ten-program quick corpus compiles all programs and admits alternatives for seven, but selects none at the default evidence gates. Quick budgets defer the new layout family. Interleaving recipe stages and allowing the balanced budget discovers two record-layout proposals and admits them on the unchanged compact-set program; this proves discovery and admission, not profitability.
Recent matched state controls
Three fresh processes and nine rotated rounds compare 4,096-row replacements with complete replies, versions, ordered events, acknowledgement and exact Ink checkpoints. The ordinary protocol control retains the same admitted record/sum layouts and preflight actions. Values below are medians of process medians, in microseconds per call.
| Boundary | Ink | Frontier main | Interpretation |
|---|---|---|---|
| Ordinary replacement | 2.817 | 1.224 | Ink takes about 2.3× longer |
| Prepared replacement | 0.919 | 0.940 | Near parity; individual processes are mixed |
Adding compact commit metadata and column event retention to this acknowledgement-heavy fixture produces mixed gains and regressions. It is not promoted as a default. Longer retained-event windows can benefit from a different storage choice; those are separate workloads. Shared-host variation is substantial, and these results do not establish universal latency or memory bounds.
Exact plans, samples and conformance
The newer package closure was measured again in processes 361–363. Ordinary replacement takes 2.585 µs versus Frontier 1.047 µs, and prepared replacement 0.555 µs versus 0.575 µs, using medians of process medians. Prepared Ink wins two processes and loses one. Against the previous Ink control ordinary calls improve 4–10%, while prepared calls regress 4–29%; the graph contains several independent changes, so these results are not attributed to the compact reader. Complete outcomes and exact snapshots pass. Unrelated compilation was active on the shared host.
Fixed and adaptive execution
The complete-session adaptive comparisons include capture, queueing, recording and migrations. At 128 numeric rows, adaptive Ink loses to both scanning Frontier and an explicitly maintained Frontier sum in all six tested histories. Fixed cached Ink's read-only session takes 6.16 ms versus scanning Frontier's 12.48 ms; Frontier's maintained sum takes 2.98 ms. The efficient fixed representation matters as much as the controller.
A separate 4,096-row lifetime study measures 65,536 reads at 12.86 ms for fixed cached Ink, 279.19 ms for adaptive Ink and 356.44 ms for scanning Frontier. The adaptive controller eventually amortizes its cost here; shorter sessions and writes still lose. This is not evidence that adaptation is always beneficial or always harmful. These studies use supplied checked alternatives, not the best conceivable aggregate implementation.
Matched complete-session controls · Longer sessions and crossover evidence
Optional JSON quotation reuse
The JSON boundary can explicitly reuse immutable quoted strings and their exact UTF-8 lengths. It retains grammar, Unicode, duplicate, member-order, source-resource and output-byte checks. Cache entry counts and estimated payload bytes are capped; no default enables the cache.
For 512-member Unicode/escape-heavy documents, three fresh processes measure about 25% less time for warm prepared rendering and 6–8% less for full text/edit/UTF-8 output. Independent 256-render sessions include cache creation, first fill, every compiled edit and full output consumption: all three take 21–24% less time than their paired uncached controls. Numeric and short-session results are mixed; cold renders are 38–40% slower on the Unicode fixture. Frontier still wins the complete text pipeline.
A separate forced-GC diagnostic measures about 106 KB retained per filled cache, with 1,024 entries and about 37 KB of estimated string payload. Clearing releases the observed retained allocation. This is a speed/memory tradeoff, not a heap reduction or peak-memory guarantee. The initial runtime prototype was later matched byte-for-byte by fresh compiler emission; all losing samples remain in the report.
Cache contracts, source, lifecycle timings and memory diagnostic
Captured-value APIs and trust scope · Bound benchmarks and corpus receipts
Follow-up controls
Three processes now interleave previous and candidate state modules within each process. Prepared replacement takes 0.709 µs previous versus 0.695 µs candidate, while Frontier takes 0.436 µs. The candidate regresses in one process; ordinary replacement also shows no consistent gain. The reusable-cell/flat-event-buffer and direct table-call experiments were removed. These measurements support no new state-speed claim.
An ownership correction preserves same-sort aliases within one detached state reply, including recursive schema paths, while retaining separate memo keys for different erased source records. It shares no mutable containers with state or another invocation. The full JavaScript, JSON/maintained-state parity and cache/subscription checks pass.
A separate planning-engine study on an Apple M4 Pro retains selective database queries, search-local derived costs and lazy negative matching. Wide search falls from 15.212 s to 1.232 s over seven paired runs with identical output digests. Matching-heavy controls are essentially unchanged and one small broad-query control loses slightly. This measures planning overhead, not compiled application execution; its ratios should not be multiplied by JavaScript runtime gains.
Rejected state experiments and ownership controls · Planning engine protocol and tradeoffs
Direct compiled JSON rendering
Generic typed reducers now let the JSON adapter render an opaque compiled handle without rebuilding the logical tagged tree. Three fresh processes retain exact outputs, source layouts, malformed-value checks and every timing lane. The table shows medians of process medians, in microseconds:
| Fields | Prepared ordinary output | Prepared direct output | Ink direct text/edit/text | Frontier text/edit/text |
|---|---|---|---|---|
| 4 | 6.050 | 2.859 | 13.269 | 0.839 |
| 64 | 34.533 | 19.058 | 70.361 | 4.241 |
| 512 | 220.497 | 122.717 | 451.177 | 99.612 |
At 512 fields, prepared rendering improves 1.58–1.80× within each process. Medium and large complete pipelines improve in all three processes, but one small-document run regresses. Input conversion and validation remain substantial costs. Frontier uses native JSON on the shared finite-integer/Unicode domain; Ink additionally preserves exact tokens/member order and enforces its source resource bounds. These contracts differ, and the shared host had other builds running. This is an opt-in API, with no universal default or all-metrics win.
The dictionary recipe's pinned database evaluation compiles all ten frozen programs, discovers alternatives for six and selects alternatives for four. Its coverage audit finds no unhandled entry roles. This establishes discovery and admission scope; it does not prove that every optimisation is profitable.
Rendering measurements and retained controls · Frozen corpus and planning gates
Measure your application
Start with the unchanged source and a baseline built by the same compiler. Keep development inputs separate from evaluation inputs. Check returned values, errors, events and snapshots before timing; consume the complete output during timing.
Include the phases your application pays for: compilation, startup, construction, calls, copying, transfers, migration, retained memory and teardown. Repeat in fresh processes and retain losing results. A faster warm query may not repay an index's setup and write costs, and a faster GPU kernel may lose once transfers are included.
Checked wire readers and automatic boundary planning
The JavaScript ABI can validate and construct an opaque compiled value in one traversal. The reader checks source frames, node/depth limits, scalar widths, tags, Unicode, canonical numeric/ID/enum text and compact counts. Invalid reads retain the generic validator's diagnostics. JSON number grammar and object-name uniqueness remain separate checks.
Three fresh paired processes compare the same source and private layout:
| 512-field boundary | Previous decoder µs | Fused reader µs | Per-process result |
|---|---|---|---|
| Compact decode | 264.192 / 345.267 / 207.442 | 103.505 / 122.053 / 86.109 | 2.41–2.83× faster |
| Complete compact decode, edit and encode | 704.841 / 823.601 / 554.333 | 504.420 / 769.757 / 449.394 | 1.07–1.40× faster |
The 64-field complete compact pipeline regresses in every process by about 8–16%. Small inputs and portable decoding have mixed results. These measurements therefore do not justify a global default or a Frontier win. Exact modules, complete outputs, unchanged inputs and portable/compact bytes accompany the reports. Cleanup archive work was paused; other shared-host work remained active.
The database now proposes reader choices per source function and format. Automatic JavaScript calibration exercises trusted, portable and compact call boundaries, measuring validation, execution, reply encoding and consumption of every output byte. Source checking remains independent of the cost decision.
One automatic packet-copy compilation admitted four plans, generated 72 calls and selected both readers under the paired uncertainty guard. Its estimated candidate/baseline ratio was 0.881 with an upper bound of 0.930. Fresh proof replay and 48 new encoded input checks passed. This single-process synthetic selection result is not heldout performance evidence or a general usage forecast. Observed profiles take precedence; missing comparable gains retains the baseline.
Wire-reader measurements and losses · Automatic selection, raw receipt and scope
Compact reader specialization
The checked compact reader now tracks depth with a counter. Portable values keep their frame-end stack; compact values still check complete-buffer bounds, node/depth limits, canonical counts, tags, Unicode and full consumption. Invalid inputs replay the independent validator for established diagnostics.
Three paired fresh processes measure 11–14% less time for complete fused compact decoding and re-encoding of a 512-member document. This is an Ink-versus-Ink result, not a new Frontier ranking. The initial module used exact support substitution; fresh compiler emission later verified the identical ABI support, and its newer emitter passed full JavaScript tests and 422 additional malformed-input/resource/value checks. Complete modules differ because JavaScript main advanced independently.
Prepared reverse models
The current CLI can construct a 244-parameter ReGLU model, prepare its graph once
and compute a fresh forward pass plus an ordered reverse pass for changing weights
and context. The matched JavaScript comparison consumes all four outputs, the loss
and all 244 gradients, checking exact agreement against Handwired's own executor
and an independent graph interpreter. It includes a stronger Handwired control
with checked [0,1] source ranges and smaller multiply expansions.
| Complete forward + reverse call | Development (µs) | Holdout (µs) |
|---|---|---|
| Ink, prepared graph | 39.32 | 40.36 |
| Handwired, unknown ranges | 29.36 | 29.48 |
| Handwired, checked source ranges | 23.58 | 23.83 |
| Direct typed-array interpreter | 10.08 | 9.72 |
Median of three fresh-process medians per cohort; eleven interleaved samples per process. Ink takes 1.69× the ranged Handwired latency on the holdout cohort.
These are warm CPU calls on one host, with fresh arrays inside each call. Graph setup has separate cold observations; import/compilation, peak memory, full gallery training and UI rendering are outside this comparison. Handwired's gallery can also specialize fixed positional features, unlike this dynamic-context task. Optimizer arithmetic is a separate comparison: Ink currently uses F32 moments. The matched speed target and device reverse execution remain open.
Raw samples, complete controls and reproduction. Full-target validation separately compares values/errors/events/exact snapshots, including backtracking and failed updates. An unrelated eligible numeric kernel confirms one actual GPU dispatch; it does not establish GPU training.
Continuous learning now has separate lifecycle validation: 39 cross-target cases and four compiled durable histories check queue/progress, serving versions, cancellation, offline bootstrap and storage failure recovery. These checks establish neither a training-throughput ranking nor a latency guarantee. The model training and Handwired comparison above still run on CPU hosts. Continuous service scope.
Build-stage validation additionally covers trained startup and continued learning on JavaScript, native, Rust and Wasm; full Adam checkpoint resume; durable store precedence; package corruption; and a trained mixed module with actual native and browser GPU numeric dispatch. Both JavaScript and Wasm build-stage candidates continue through the cooperative service to exact expected checkpoints. This is adaptive deployment, with CPU-host training; it adds no throughput or memory claim to the comparison above. Retained package and validation evidence.
Structured preparation lifecycle
On M4 Pro / Node 25.3.0, the same checked source and trained checkpoint under the old and current JavaScript emitters produce these held-out medians:
| Complete workload | Previous | Structured retention | Ratio (previous/current) |
|---|---|---|---|
| Neural prediction | 39.06 µs | 11.33 µs | 3.45× |
| Read selected names, 4096 rows | 637.94 µs | 210.19 µs | 3.04× |
| Return whole structure, 4096 rows | 5325.58 µs | 5243 µs | 1.02× |
| Update + one read, 128 rows | 31.75 µs | 65.10 µs | 0.49× |
| Update + sixteen reads, 128 rows | 325.85 µs | 175.60 µs | 1.86× |
| Training turn, no predictions | 310.93 µs | 386.17 µs | 0.81× |
| Training turn + sixteen predictions | 1510.68 µs | 730.13 µs | 2.07× |
Six fresh processes separate development and holdout inputs, with eleven interleaved samples per cell and complete output consumption. Training feedback and exact checkpoints agree. The prepared prediction remains about 31× slower than a separate dense numeric kernel that excludes state/ABI overhead; these measurements do not establish parity with Handwired's different workloads.
Cold and memory costs matter. The first 4096-row names read increases from 0.70 to 1.77 ms. A separate 16,384-row process retains about 1.7 MB more heap. Native performance, automatic lifecycle selection and device training are not measured here. These observations support stable-input reuse and retain the cases where it loses; they grant no automatic profitability authority.
Prepared defaults for mutable models
Explicit keeps can now supply value-state defaults, so repeated reads reuse a default while live training state continues to change. This is authored source staging with a distinct source identity. Both deployments were fitted independently from the same twelve-frame trace, and their complete typed logical state agrees. The two earlier emitter controls retain their shared source and checkpoint.
M4 Pro / Node 25.3.0; medians of three holdout-process medians, with eleven mixed-order samples per cell and complete output consumption:
| Complete prediction | Latency |
|---|---|
| Scalar-only keep retention | 38.08 µs |
| Structured keeps | 11.12 µs |
| Prepared defaults | 9.38 µs |
The additional gain over structured keeps is 1.19×; the gain over the scalar control is 4.06×. A separate dense kernel takes about 0.34 µs with a narrower boundary, leaving a roughly 28× gap. This adds no Handwired parity claim.
| Predictions per training turn | Structured keeps | Prepared defaults |
|---|---|---|
| 0 | 221.32 µs | 214.40 µs |
| 4 | 281.85 µs | 264.30 µs |
| 16 | 467.00 µs | 425.46 µs |
These histories include two Adam steps per turn and an extra rolled-back frame every fourth turn. Restore, snapshot comparison and hashing are outside timing; input capture, replies/events and predictions are included. Outcomes and full state payloads agree across serving cadences. The earlier study's training-only regression remains evidence for its different contexts and histories.
Costs remain visible. The observed first prediction increases from 3.64 to 3.77 ms. Separate-process heap deltas have medians of 326,256 and 333,056 bytes, including engine/JIT effects after explicit collection. These are neither memory bounds nor allocation counts. Automatic profitable staging, native performance ranking, graph/arithmetic specialization and device training remain open.
Raw measurements, source bindings and validation · Reproduction.
Pure helper preparation
A sealed JavaScript partial call can retain stable graph checks through ordinary helpers while weights/context/targets change. Prior and current emitters compile exactly the same checked source. Each process loads one Ink artifact; complete detached binary32 results are consumed and checked. This boundary differs from the stateful studies above, so their absolute timings are not interchangeable.
M4 Pro / Node 25.3.0, holdout medians of three fresh-process medians:
| Complete warm call | Four outputs | Loss, outputs, 244 gradients |
|---|---|---|
| Previous ordinary | 10.25 µs | 23.94 µs |
| Previous prepared | 10.23 µs | 24.08 µs |
| Current ordinary | 10.74 µs | 25.34 µs |
| Current prepared | 9.20 µs | 23.51 µs |
| Handwired, checked source ranges | 4.12 µs | 22.29 µs |
| Independent graph interpreter | 6.02 µs | 18.36 µs |
| Independent dense forward | 0.34 µs | — |
The new prepared path improves prediction 1.11× and full gradients 1.025× over the prior prepared path. Ordinary calls regress about 4.8% / 5.9% despite byte-identical ordinary function bodies; module layout and prepared code differ. Handwired's range-specialized executor still leads. The broad matched-speed goal remains open.
Module bytes rise from 855,312 to 870,459. Separate cold/memory processes observe first prepared predictions of 0.922 / 0.939 ms and retained heap deltas of about 3.03 / 3.04 MB, including source metadata, JIT, Node and caches. These observations are not memory bounds or established startup rankings. Capture, import and setup costs are retained, and no automatic profitability decision is introduced.
The new mechanism is a JavaScript pure-call capability, with fresh neural primals and malformed-graph validation. These are host measurements; no GPU training, whole-session optimizer, native prepared-call or frozen graph-speed claim follows. Full-source reverse AD and graph/arithmetic specialization remain separate work.
Raw samples, exact bindings, faster controls and validation · Reproduction.
Binary64 precision foundation
Explicit f64 now preserves measurement precision across compiled CPU values,
state, events and portable checkpoints. The retained 65-case history compares
values/errors/events across reference, Rust, JavaScript, Wasm and the native GPU
host. CPU targets compare every checkpoint; the GPU host additionally compares
its exact final checkpoint. A separate frozen-state history checks rebinding and
changed-row rejection. Both histories require an actual F32 GPU dispatch; F64
computation stays on the CPU.
This is a conformance and interoperability milestone. It supplies no new timing claim, F64 AD, binary64 proof domain or complete Pretext port. The source-pinned F32 measurements above remain historical results for their named emitters, not performance claims for every later compiler revision.
Exact sources, isolated core/package checks and target receipts.
Prepared text fidelity baseline
The initial std:prepared_text source port preserves Pretext's simple prepared
counter and full line geometry on 232 upstream oracle cases. A separate
182-observation compiled history includes cursor continuation, edits, resizes,
rollback and restore. These use synthetic measured facts; they do not establish
browser or font accuracy. The complex walker and measurement preparation remain
open.
The first short JavaScript diagnostic still places Ink well behind the upstream direct loop: at 512 segments, median complete count calls measured about 16.6 µs for Ink's prepared lane and 0.81 µs for Pretext. Setup, capture and first-call costs are retained separately. One process with short samples does not establish a portable ranking or broad speed claim. Moving validation into explicit contracts did not consistently improve calls. This is a measured remaining execution gap, not completion of the performance target.
Exact source/artifacts, oracle, raw samples and target history.
Sequential callback preparation
This JavaScript comparison uses the same checked core bytes through the previous and current emitters. Three fresh processes per cohort execute complete varying outputs, including empty, singleton and 32-item requests. Capture, token setup, first observations and direct-control construction are retained separately; materializing and consuming outputs is timed. The table shows held-out 512-item fixed inputs, with medians of per-process medians in microseconds.
| Repeated work | Previous prepared | Current prepared | Direct prepared | Paired gain |
|---|---|---|---|---|
| Membership index | 197.07 | 1.19 | 0.76 | 164.69× |
| Grouped aggregates | 264.23 | 1.14 | 0.73 | 231.65× |
| Numeric coefficient table | 18.92 | 0.84 | 0.45 | 22.90× |
These are explicit reuse workloads on Node 25.3.0 / Apple M4 Pro. Paired gain is the median process-pair ratio and can differ from the ratio of displayed medians. The direct controls remain faster. Development's 16-item coefficient case loses (0.876×); short lifetimes can fail to recover preparation costs. Ordinary calls have no corresponding broad speedup, and retained heap increases in the separate forced-GC observation.
The same emitter change does not establish neural or layout gains. Held-out prediction has paired gain 0.969× and complete gradients 1.002×. Handwired's range-specialized prediction remains about 2.2× faster, while the explicit dense prediction control is about 29× faster. At 512 text segments, the simple counter measures 15.31 µs currently, 14.38 µs previously and 0.78 µs for pinned Pretext. Those are remaining execution gaps, not completed performance targets.
The standalone backend suite passes 49 tests; callback validation covers 147 reference cases and 1,510 prepared calls under each F32 carrier. Learning, binary64 and text target histories also pass, including an actual eligible F32 GPU dispatch. These checks do not prove compiler correctness or device training.
Raw samples, exact package/source bindings, lifecycle costs and validation · Reproduction.
Finite binary64 constants
A later JavaScript emitter change removes repeated bit conversion for finite binary64 literals, preserving signed zero, arithmetic order and explicit NaN payload transport. The same checked text counter is compared with the callback emitter above, using three fresh processes and the pinned Pretext control.
At 512 segments, median complete prepared calls improve from 14.54 µs to 9.41 µs (paired gain 1.49×); Pretext takes 0.79 µs. At 8 and 64 segments, paired gains are about 1.17×. Ordinary 8-segment calls regress in the same short sample. This is a designed diagnostic, with setup and first calls retained separately; it does not establish broad numeric performance or full text fidelity. Pretext still leads by about twelve times on the large counter.
The standalone backend suite passes 50 tests, including 2,210 raw-bit cases across pure, compiled, prepared and action execution. Binary64 and text target histories also pass. Exact artifacts, raw samples, exploratory profile and validation.
Immutable bindings and generated size
The current CLI avoids redundant JavaScript aliases for immutable values while retaining snapshots of mutable loop, branch and recursive-call state. Emitted modules shrink 2.12% for the prepared text counter, 2.95% for the neural model and 0.54% for the collection workloads, using identical checked-core inputs.
This is code-size progress. Execution timings are mixed: the short three-process text diagnostic improves the 512-segment prepared counter by about 5%, leaves the 64-segment case roughly unchanged and regresses the 8-segment case. Pretext still leads substantially. Neural and collection observations also contain wins and losses; none establishes a broad speedup or closes the three-project target.
The standalone JavaScript suite passes 51 tests, including 2,160 new exact-bit alias/snapshot cases. Required-target histories and browser replay preserve results, events and checkpoints, with separate actual GPU kernels. Source tapes still execute on CPU hosts. Complete observations, controls, package pins and validation.
Optional and result callback preparation
A later JavaScript emitter can reuse immutable captured work inside selected
Option/Result callbacks, including captured payloads and partial record fields.
The same checked source bytes pass through the previous and current emitters.
Three fresh Node 25.3.0 processes use randomized lane order, 1,536 warm-up calls
per lane and complete varying array outputs, including materialization and
consumption. Capture, token setup and first calls are retained separately.
Pooled median complete calls at 512 fixed inputs, in microseconds:
| Workload behind a changing sum arm | Previous prepared | Current prepared | Direct prepared JS | Previous/current |
|---|---|---|---|---|
| Membership index | 198.09 | 1.371 | 0.748 | 144.5× |
| Grouped aggregates | 282.30 | 1.942 | 0.747 | 145.4× |
| Numeric coefficient table | 18.45 | 1.183 | 0.436 | 15.6× |
These are designed reuse workloads; direct controls remain faster. Ordinary 512-input calls regress about 1%, 1% and 4.9%. One forced-GC observation records 60,408 additional retained heap bytes and first singleton work increasing from 0.480 to 0.591 ms. Those observations establish neither allocation counts nor memory bounds, and short sessions may lose on preparation costs.
The simple text counter improves about 1.8% at 512 segments, from 9.460 to 9.288 µs; pinned Pretext takes 0.783 µs. The complex walker regresses 3.3–4.1% across six fresh alternating-order processes and still takes roughly 24–26× the upstream time. Record/helper execution and deeper representation specialization remain performance targets. No neural speed gain is claimed for this change.
All 54 standalone JavaScript tests pass. New coverage compares 111 independent reference cases through 6,660 prepared calls across two physical sum layouts and both F32 carriers. A distribution fixture compares 112 observations on native Rust, JavaScript, Rust-Wasm and the native GPU host, plus 672 prepared JS calls. One numeric control confirms actual device execution; sum preparation itself remains a JavaScript feature. Complete complex geometry and changing-weight neural controls preserve their independent results. These checks do not prove the complete compiler or establish upstream performance parity.
Exact sources, raw samples, lifecycle costs and validation · Execution contract.
Local record and helper execution
A later CLI JavaScript emitter keeps readonly record fields local through value loops, bounded helpers and conditional record results. The same checked core bytes pass through previous and current emitters. Six fresh Node 25.3.0 / Apple M4 Pro processes alternate artifact order over three engine-profile rotations, with 2,048 warm-up calls per lane and complete varying count observations. Materialization and consumption are timed; capture, token setup and first calls remain separate.
At 512 complex text segments, median process medians in microseconds are:
| Numerical profile | Previous prepared | Current prepared | Pretext direct |
|---|---|---|---|
| Blink | 155.00 | 133.23 | 5.89 |
| Gecko | 153.78 | 128.45 | 6.07 |
| WebKit | 157.17 | 134.38 | 5.85 |
Prepared process-pair gains range from 1.14–1.21× and ordinary gains from 1.18–1.24×. The current walker still takes roughly 21–23× the upstream time. Synthetic measured facts do not establish browser/font accuracy or full text preparation.
Simple text retains two warm-up regimes, with three fresh processes each. The 512-segment prepared case gains in every pair, but smaller calls have substantial losses. With longer warm-up, ordinary 64-segment calls increase from 3.831 to 5.725 µs, and prepared 8-segment calls from 1.212 to 1.615 µs. With shorter warm-up, prepared 64-segment calls increase from 6.040 to 7.773 µs. Both regimes, full outputs and cold/setup observations remain in the report. Pretext still leads.
The neural comparison emits byte-identical code before and after this change. Its complete predictions and gradients remain an unchanged-code control, with faster ranged and dense implementations retained. It establishes no neural code-generation or speed gain. Deeper graph/tape specialization remains required.
Complex source grows about 5.8%; the simple counter grows about 2.3%. All 55 standalone JavaScript tests pass, with 7,560 calls in the expanded independent record fixture. A distribution fixture compares 253 observations across native, JavaScript, Rust-Wasm and the native GPU host, including one actual numeric device control. Complete text lifecycle and source-reverse controls preserve events and exact snapshots. These checks do not prove the complete compiler or make record execution a GPU feature.
Raw samples, exact images, full validation and audit · Mechanism and bounds.
Normalized F32 neural execution
A later CLI JavaScript emitter avoids repeated normalization of already internal F32 values. Exact NaN tags, arithmetic rounding and operation order remain intact; borrowed host fields still normalize at each typed read. There is no new syntax, model algorithm, arithmetic rewrite or automatic selection rule.
Six fresh Node 25.3.0 / Apple M4 Pro processes compare identical checked core bytes through the previous and current emitters, alternating order across three seeds. Each task/lane warms for 4,096 calls and records eleven randomized samples. Complete detached outputs are consumed and checked against an independent ordered F32 executor, including loss, four outputs and all 244 gradients. Weights, context and targets vary; input capture, import, graph/token construction and first calls remain separate retained costs.
Median process medians in microseconds:
| Task | Lane | Previous | Current | Paired speed ratios |
|---|---|---|---|---|
| Prediction | Ordinary | 10.679 | 10.188 | 0.994–1.086× |
| Prediction | Prepared | 9.181 | 8.732 | 0.971–1.063× |
| Complete derivatives | Ordinary | 26.241 | 22.502 | 1.166–1.228× |
| Complete derivatives | Prepared | 24.399 | 20.611 | 1.100–1.208× |
Derivative gains hold in every process pair. Prediction includes a slower pair. On the same current processes, Handwired's ordinary/ranged prediction medians are 10.757/4.578 µs and complete derivatives 33.125/24.499 µs. The independent direct graph is faster at derivatives (19.154 µs), and a dense prediction control takes 0.363 µs. These controls bound the conclusion to this workload and these CPU executors; broad Handwired parity and device training remain open.
The module shrinks from 839,419 to 837,601 bytes. Simple and complex text images are byte-identical across this change, so it establishes no new text speed gain. All 56 JavaScript tests pass, including 29,820 independent-reference compiled/prepared calls in the new fixture, with raw-host/getter/contract checks. Required-target validation compares 295 complete results and snapshots; 169 eligible calls execute on the GPU. Other cases retain CPU host execution. Fresh neural, source-reverse and binary64 controls pass. These checks do not prove the emitter or toolchain, and deeper learned structural specialization remains open.
Raw samples, exact images, cold costs and audit · Execution contract.